Lead Response Time Statistics: 30+ Data Points (2026)
How fast you respond to a lead changes everything. The data has been clear on this for over a decade — but the benchmarks keep evolving as channels shift from phone and email to DMs.
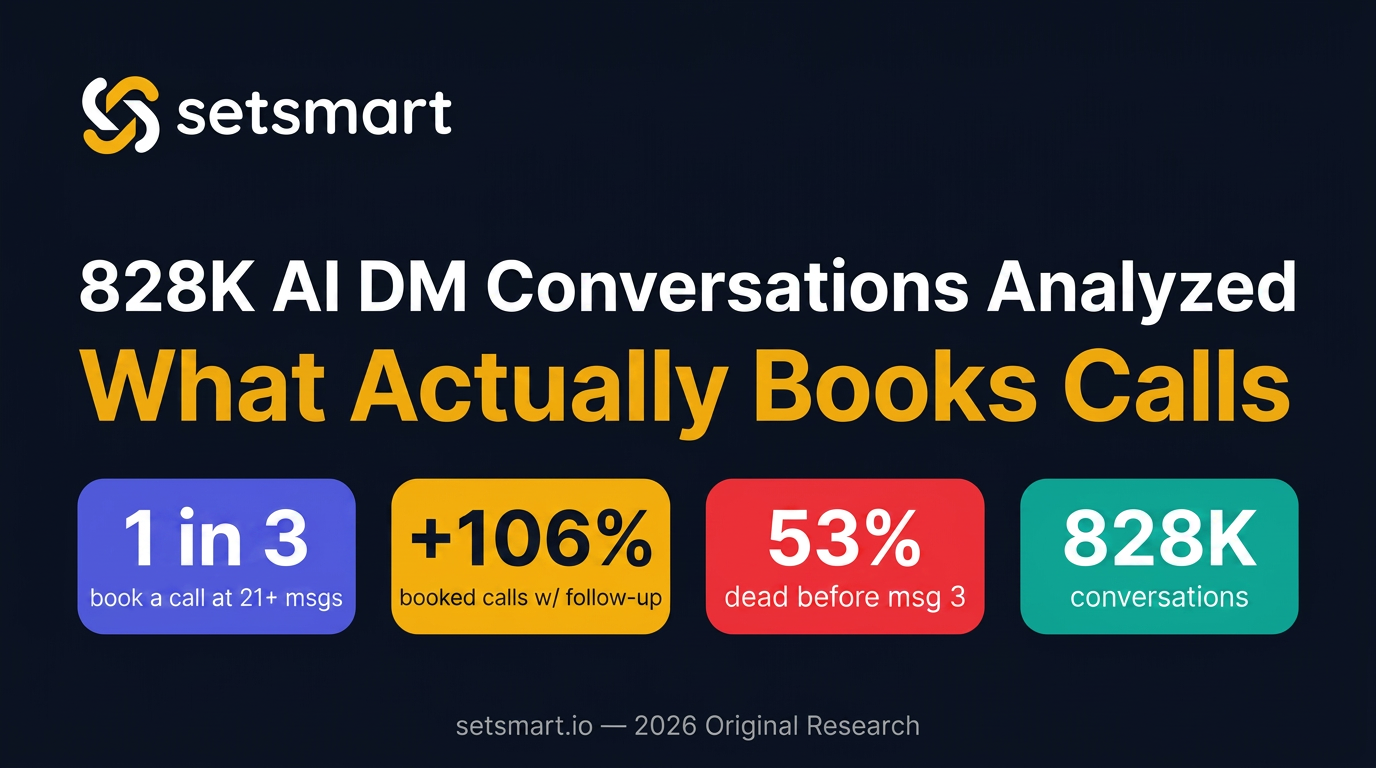
This page compiles every major lead response time statistic in one place: the classic studies, the latest benchmarks, and new data from our analysis of 828K AI DM conversations.
General Lead Response Time Statistics
- Companies that respond within 5 minutes are 21x more likely to qualify a lead than those who wait 30 minutes. (Harvard Business Review, 2011)
- The average company takes 47 hours to respond to a lead. That's nearly 2 full days. (Harvard Business Review, 2011)
- 78% of customers buy from the first company that responds. Speed isn't a nice-to-have — it's the deciding factor. (Lead Connect, 2023)
- Only 7% of companies respond to a lead within 5 minutes. The vast majority miss the critical window. (Drift, 2023)
- 23% of companies never respond at all. Nearly 1 in 4 leads are completely ignored. (Harvard Business Review, 2011)
- 50% of sales go to the vendor that responds first. Not the best vendor — the fastest. (InsideSales.com)
- Contacting a lead within 1 minute yields 391% higher conversion rates compared to waiting just 2 minutes. (Velocify)
- Odds of qualifying a lead drop 10x between 5 minutes and 10 minutes. The decay curve is steep. (InsideSales.com / MIT, 2012)
- After 30 minutes, your chances of qualifying a lead are 21x lower than if you'd responded in the first 5 minutes. (Harvard Business Review, 2011)
- 35-50% of sales go to the vendor that responds first. (InsideSales.com)
Lead Response Time by Channel
- Email: average response time is 8.5 hours. Customer expectation is under 4 hours. 62% of emails are abandoned if no response within 48 hours. (SuperOffice)
- Phone: calling within 5 minutes makes you 100x more likely to reach the lead compared to calling after 30 minutes. (InsideSales.com / MIT, 2012)
- WhatsApp: 98% open rate, with a median read time under 3 minutes. Response rates on outbound campaigns range from 25-45%. (AnswerForMe, 2026)
- Instagram DMs: 90% open rate — nearly 5x email. Reply rates reach up to 60%. (LeadResponse, 2026)
- Live chat: customer expectation is under 1 minute. It's the channel with the most demanding speed expectation. (SuperOffice)
AI DM Response Time Statistics (New Data)
The following statistics come from our original study of 828,761 AI DM conversations across 391 businesses, from July 2024 to March 2026.
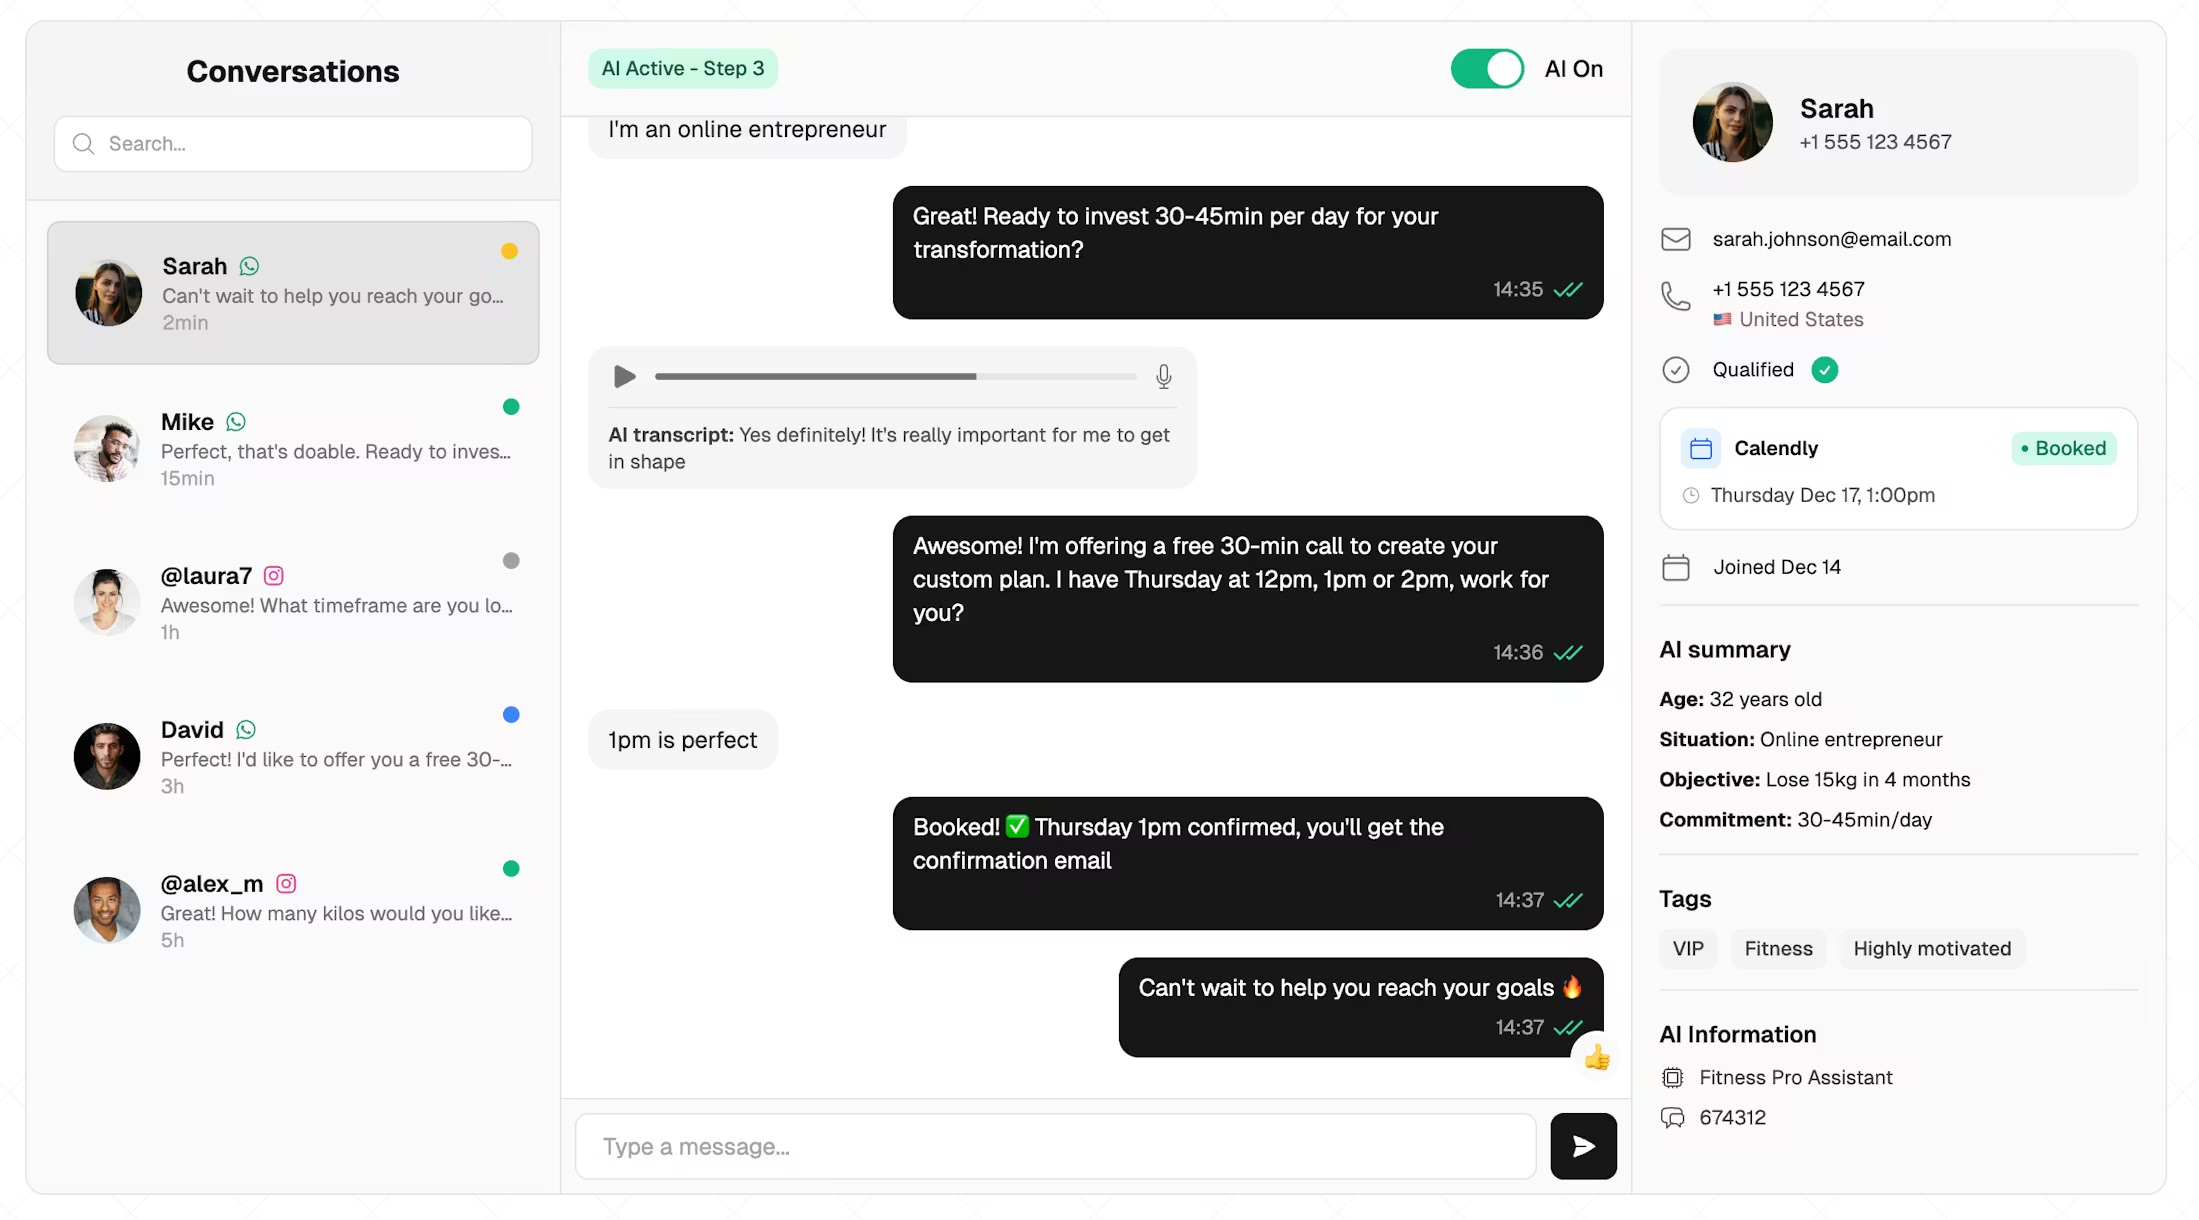
- AI responds to DM leads in under 5 seconds. Compared to the industry average of 47 hours, that's a 33,000x improvement. (SetSmart study, 2026)
- AI responds within 5 minutes 100% of the time. Only 7% of companies without AI achieve this. (SetSmart study, 2026)
- 53% of AI DM conversations die before the 3rd message. Even with instant response, more than half of leads never engage beyond the initial exchange. (SetSmart study, 2026)
- At 21+ messages (~10+ exchanges), 1 in 3 leads books a call (29%). At 1-4 messages, the rate is 0.07%. Conversation depth matters more than speed alone. (SetSmart study, 2026)
- Conversations with 11+ messages (~5-10 exchanges) are 68x more likely to qualify than those with 1-4 messages. The 11-message threshold is the inflection point. (SetSmart study, 2026)
- A single automated follow-up doubles booked calls (+106%). Among leads who engaged, one follow-up message is the highest-leverage action in the dataset. See our full AI lead follow up guide for timing, templates, and channel rules. (SetSmart study, 2026)
- On Instagram, a follow-up nearly triples qualification (+182%). Many Instagram leads respond once and go silent; the follow-up pulls them back. (SetSmart study, 2026)
- WhatsApp responders qualify at 33.96% — nearly double Instagram's 17.77% rate among engaged leads. (SetSmart study, 2026)
- WhatsApp responders book calls at 18.82% — 3x the rate of Instagram among engaged leads. (SetSmart study, 2026)
- WhatsApp leads qualify in 13% fewer messages than Instagram leads (20 vs 23 median messages). WhatsApp conversations are more direct. (SetSmart study, 2026)
Follow-Up Statistics
- The average salesperson makes 1.3 follow-up attempts before giving up. 44% give up after the first attempt. (Brevet Group)
- 80% of sales require 5 or more follow-ups. But most reps stop at 1-2. (Marketing Donut)
- AI follow-ups are automated and unlimited. The AI continues following up on a preset schedule without fatigue or forgetting. (SetSmart study, 2026)
- Among engaged leads, follow-ups increase qualification from 19.17% to 40.65% (+112%). (SetSmart study, 2026)
- Among engaged leads, follow-ups increase booked calls from 8.66% to 17.84% (+106%). (SetSmart study, 2026)
Business Performance Statistics
- Top 10% of businesses using AI DMs achieve a 31.78% qualification rate. Bottom 25% achieve just 0.67%. Same AI, same channels — configuration matters. (SetSmart study, 2026)
- Top 10% book calls at 13.60%. Bottom 25% book at 0.39%. (SetSmart study, 2026)
- Time of day and day of week have almost no impact on AI DM performance. The gap between the best and worst time slot is less than 0.5 percentage points. AI's advantage is consistency, not timing. (SetSmart study, 2026)
What the Data Tells Us
The original "5-minute rule" from 2011 still holds — speed matters. But in the DM era, AI has made speed a solved problem. Every lead gets a response in under 5 seconds, every time.
The new frontier is conversation depth. When response time is instant, the differentiator becomes how many messages you exchange and whether you follow up when leads go silent. The data is clear: hit 11+ messages and your qualification rate jumps 68x. Send one follow-up and your booked calls double.
For the full analysis behind these statistics, read our complete study: 828K AI DM Conversations Analyzed: What Books Calls.
Ready to implement? See our comparison of the best AI setters or our complete guide to Instagram DM automation.
Sources
- Harvard Business Review (2011) — James Oldroyd, Kristina McElheran, David Elkington. "The Short Life of Online Sales Leads."
- InsideSales.com / MIT (2012) — Lead Response Management Study
- Lead Connect (2023) — Speed to Lead Report
- Drift (2023) — State of Conversational Marketing
- Velocify — Lead Response Research
- Brevet Group — Sales Follow-Up Statistics
- Marketing Donut — Lead Nurturing Statistics
- SuperOffice — Customer Service Benchmark Report
- SetSmart (2026) — 828K AI DM Conversations Analyzed. Original research based on 828,761 conversations and 5.6M messages across 391 businesses.
Ready to automate your DMs?
Start your free 7-day trial and let AI handle your lead qualification 24/7.
Try SetSmart free